



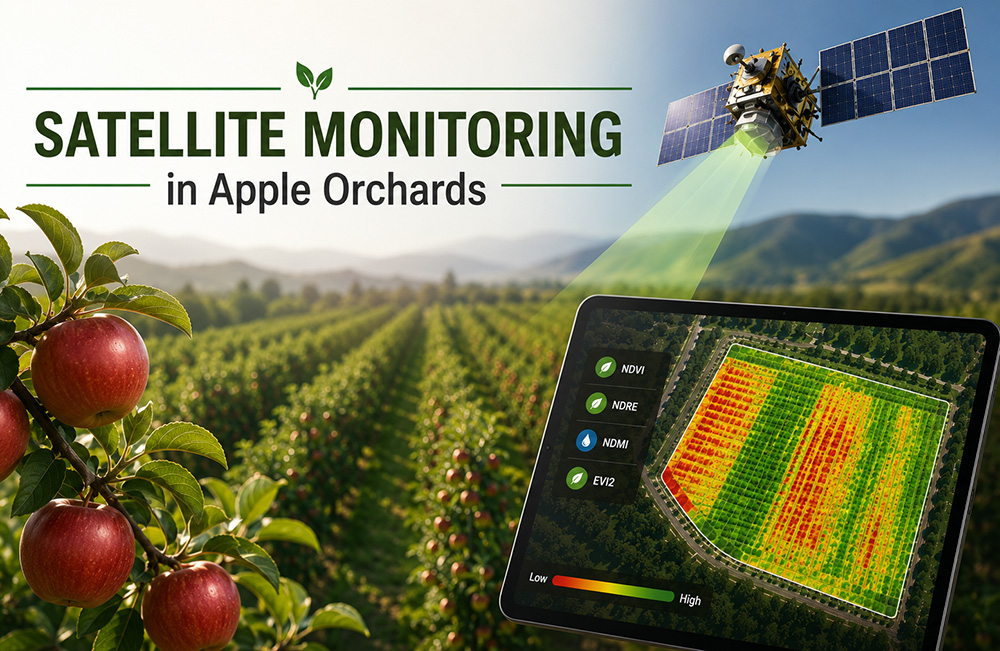
An apple grower can learn a great deal by walking through an orchard. Leaves, shoots, fruit load, irrigation, pests, diseases and tree vigour all leave clues. But there is a limitation: you cannot physically inspect every tree, every row and every corner of a large orchard every few days. This is where satellite monitoring can add another layer of information.
Instead of looking at one tree at a time, satellite imagery allows us to look at the orchard as a whole and identify patterns that may not be obvious from the ground. Changes in canopy vigour, moisture-related stress and spatial variability can be observed, mapped and compared over time. Satellite monitoring does not replace the grower, agronomist or field visit. It provides another set of eyes—one that can look across the entire orchard repeatedly.
Research in apple orchards has also demonstrated the usefulness of Sentinel-2-derived vegetation indices for tracking seasonal canopy development. A 2026 study from SKUAST-K, Shalimar, found that indices including NDVI, SAVI, MSAVI and EVI followed the seasonal development of apple canopy through the growing season.
What is satellite monitoring?
Satellite monitoring is the use of satellite imagery and data to observe changes on the Earth’s surface over time. For agriculture, a satellite is not simply taking an ordinary photograph of an orchard. Its sensors measure how the Earth’s surface reflects different wavelengths of light.
Plants interact with sunlight in a very specific way. Healthy green vegetation absorbs considerable amounts of visible red light for photosynthesis while reflecting relatively more near-infrared radiation. When canopy structure, chlorophyll content, moisture or vegetation density changes, the pattern of reflected light changes as well.
These differences can be converted into mathematical measurements called spectral or vegetation indices. This allows us to move beyond simply asking: “What does the orchard look like?” and start asking: How vigorous is the canopy? Where might moisture stress be developing? Is one part of the orchard behaving differently? Is the orchard improving or deteriorating? Where should the grower investigate first?
Why is satellite monitoring useful for apple orchards?
Apple orchards are particularly suitable for satellite monitoring because the canopy develops through a recognisable seasonal cycle.
In spring, trees begin producing leaves and developing their canopy. During summer, vegetation activity is generally high. As the crop approaches maturity and the season progresses, canopy activity eventually changes again. Satellite imagery can capture these changes. More importantly, it can capture differences within the orchard.
Imagine a five-hectare orchard where most trees are growing uniformly, but one corner is consistently weaker. From the orchard entrance, this may not be obvious. A satellite-derived vegetation map can highlight that area and give the grower a reason to investigate it. The cause could be irrigation, soil variation, drainage, disease, pests, nutrient availability, tree age, pruning or another management issue.
The satellite does not necessarily tell you why the area is weak. It helps tell you where to look.
How does a satellite see an orchard?
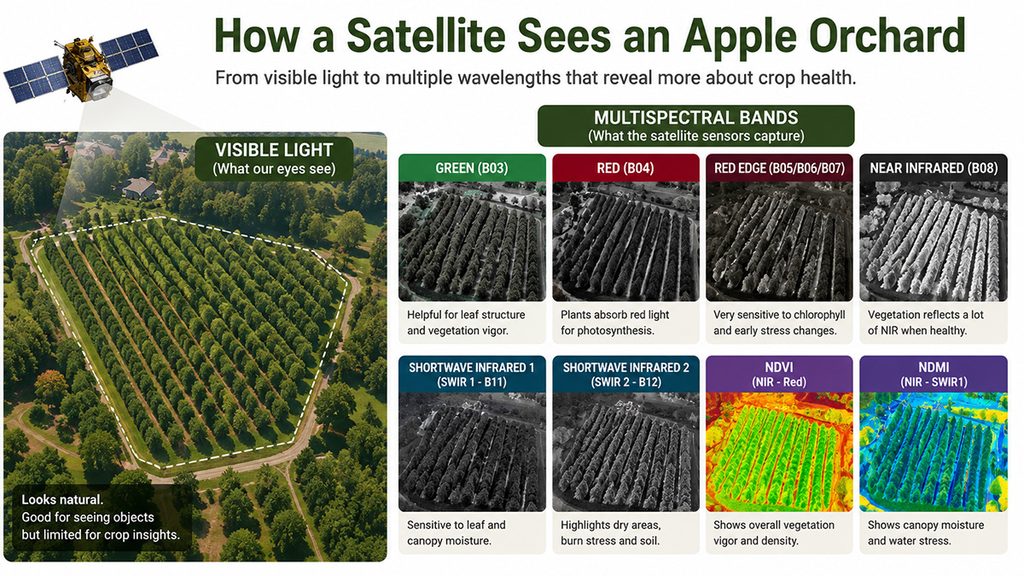
Modern Earth-observation satellites carry sensors that record reflected energy in different portions of the electromagnetic spectrum.
For vegetation monitoring, some of the most useful regions include:
Green → Red → Red-edge → Near-infrared (NIR) → Short-wave infrared (SWIR)
Each provides a different piece of information.
Visible red light is strongly associated with chlorophyll absorption, while near-infrared reflectance is strongly influenced by vegetation structure.
Red-edge wavelengths can provide additional information about chlorophyll and canopy condition, while short-wave infrared wavelengths are sensitive to vegetation water content and moisture-related characteristics.
Satellites such as Sentinel-2 are particularly useful for agricultural monitoring because they provide multiple spectral bands, including several red-edge bands. This allows different combinations of bands to be used for different types of analysis.
What are vegetation indices?
A vegetation index is a mathematical calculation that combines information from different spectral bands. The best-known example is NDVI.
NDVI — Normalized Difference Vegetation Index
NDVI uses red and near-infrared reflectance: NDVI = (NIR − Red) / (NIR + Red)
The resulting value provides an indication of vegetation activity and canopy density.
NDVI is one of the most widely used vegetation indices in remote sensing and remains an important baseline for crop monitoring. But NDVI is not a universal plant-health meter.
Dense vegetation can cause NDVI to become less sensitive, while soil background, canopy structure and other factors can also influence the value. This is why modern agricultural monitoring often uses multiple indices rather than relying on NDVI alone.
The important satellite indices for apple orchards
There are dozens of vegetation indices used in remote sensing. Growers do not need to know all of them. What matters is understanding what the major indices are trying to tell us.
NDVI — A general view of vegetation vigour
NDVI is the most familiar vegetation index. It is useful for observing general differences in vegetation density and canopy activity and for comparing different areas of an orchard or tracking changes over time.
If one part of an orchard consistently has lower NDVI than the surrounding block, that area may deserve field inspection. But a low NDVI value does not automatically mean disease, nutrient deficiency or water stress. It is a vegetation signal.
EVI and EVI2 — Looking at dense canopy
The Enhanced Vegetation Index (EVI) and EVI2 were developed to improve sensitivity to vegetation in situations where NDVI can become less informative.
EVI2 uses near-infrared and red reflectance and can provide another view of canopy vigour, particularly where vegetation is dense. This can be useful in mature apple orchards with substantial canopy cover.
For growers, the practical takeaway is simple: EVI2 gives another perspective on canopy vigour where a dense canopy may limit the usefulness of NDVI alone.
SAVI — Useful where soil is visible
Young orchards, sparse canopies and orchards with considerable visible ground between trees create another challenge. Part of the satellite signal may come from the soil rather than vegetation.
SAVI — Soil Adjusted Vegetation Index — introduces a correction for soil brightness. This makes it useful where vegetation cover is relatively sparse. For young apple orchards, where rows and soil remain clearly visible from above, soil-adjusted indices can therefore provide useful additional information.
NDRE — Looking at the red edge
One of Sentinel-2’s useful characteristics is its red-edge bands. The red-edge region sits between visible red and near-infrared wavelengths and is sensitive to changes in vegetation and chlorophyll.
NDRE — Normalized Difference Red Edge Index — combines near-infrared and red-edge information.
Compared with traditional NDVI, red-edge indices can remain useful in denser vegetation and may be more sensitive to changes associated with chlorophyll. This makes NDRE particularly interesting for mature orchards.
GNDVI — Another view of canopy greenness
GNDVI, or Green Normalized Difference Vegetation Index, uses the green band instead of the red band. It can provide a different sensitivity to canopy greenness and chlorophyll-related characteristics.
Because canopy greenness can be associated with nutritional status, GNDVI is sometimes used as an indicator of nitrogen-related variation. But satellite imagery does not directly measure kilograms of nitrogen per hectare in your soil. If a satellite indicates a potentially nutritionally stressed area, the correct response is to investigate it using field observations and, where appropriate, soil or plant analysis.
NDMI — Looking at canopy moisture
Not every satellite index is about greenness. NDMI — Normalized Difference Moisture Index — uses near-infrared and short-wave infrared information to provide a signal related to vegetation moisture. This makes it useful for identifying spatial patterns of moisture-related stress.
Imagine an orchard with a good overall vegetation score, but one section has a significantly lower NDMI. That difference can provide a reason to investigate: irrigation uniformity, blocked emitters, soil differences, drainage, root-zone conditions & differences in canopy development.
NDWI — Another view of water-related conditions
NDWI can refer to different formulations depending on the bands being used and the purpose of the analysis. In agricultural applications, water-related indices can provide additional information about vegetation or surface-water conditions.
MSI — Moisture Stress Index
The Moisture Stress Index (MSI) uses SWIR and NIR information. It provides another perspective on vegetation moisture stress. Unlike many vegetation indices, higher MSI generally indicates greater moisture stress.
When used alongside NDMI and other information, MSI can therefore contribute another perspective on the orchard’s moisture condition.
NBR — Detecting major canopy disturbance
NBR — Normalized Burn Ratio — was originally developed for detecting burned areas. Its spectral response can also be useful for identifying severe vegetation disturbance or canopy loss. In an orchard, a strong anomaly may indicate significant canopy damage.
Why one index is never enough
This is perhaps the most important concept for growers. Suppose an orchard has a low vegetation index.
That does not automatically mean: “The orchard needs fertilizer.”
The cause could be: water stress, disease, pest damage, poor drainage, soil variation, nutrient availability, canopy differences, tree age, pruning & seasonal development. Different indices respond to different characteristics of vegetation. That is why a more useful satellite-monitoring system looks at multiple signals together.
Satellite monitoring is about change, not just a single number
A single satellite image can be useful. A time series is much more useful. Suppose your orchard has an NDVI of 0.62 today. Is that good? The number alone doesn’t tell you much. But suppose it was 0.65 two weeks ago and 0.62 today. That is a change worth watching.
If it falls further while moisture-related indices also deteriorate, the signal becomes much more interesting. This is why satellite monitoring can become a form of continuous orchard observation.
The question changes from: “What is my orchard’s NDVI?” to: “How is my orchard changing?”
Heatmaps: when the average hides the problem
One of the biggest advantages of satellite monitoring is spatial information. Imagine two orchards.
Orchard A: NDVI is around 0.61 throughout the block.
Orchard B: average NDVI is also 0.61—but one section is 0.70 and another is 0.52.
The averages are identical. The orchards are not. A heatmap makes this difference visible. Instead of seeing only one number, the grower can see where the variation occurs. This can help identify areas that deserve closer inspection for: irrigation problems, weak tree zones, drainage issues, soil variation, pest or disease-related stress, differences in canopy development & management inconsistencies.
Research has also demonstrated the use of high-resolution satellite imagery for assessing spatial variation in orchard characteristics and water requirements.
But satellite monitoring has limitations
Satellite monitoring is powerful, but it is not magic.
Clouds matter
Optical satellites cannot properly observe the orchard through heavy cloud cover. Cloud shadows, snow and other image-quality problems can also affect the usefulness of an image.
Resolution matters
A satellite pixel represents an area on the ground. Sentinel-2’s resolution makes it useful for identifying orchard-level patterns and patches, but it is not designed to tell you what is happening to an individual apple leaf.
Season matters
An index value that is normal at one crop stage may not mean the same thing at another. Young trees, flowering orchards, full-canopy summer orchards and orchards approaching senescence naturally produce different spectral signals.
Indices are not diagnoses
A red area on a heatmap does not mean: “This is nitrogen deficiency.” Nor does it mean: “This is apple scab.” It means: “Something about this area’s spectral response is different enough to investigate.” That distinction is critical.
Where Orchardly comes in
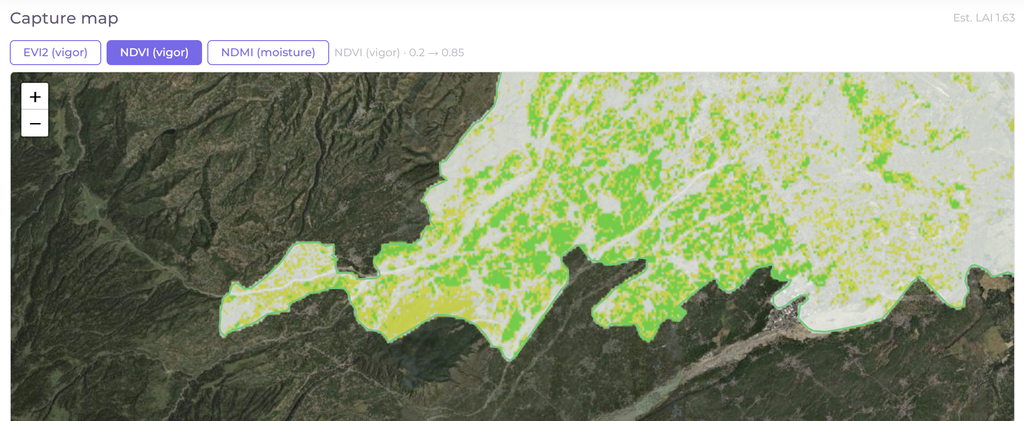
Satellite monitoring becomes much more useful when it is connected to the actual orchard. Orchardly uses Copernicus Sentinel-2 Level-2A surface-reflectance data and analyses it within the mapped orchard boundary rather than simply using a farm-centre GPS point.
The system filters unsuitable pixels such as cloud, cloud shadow and snow and identifies usable imagery for monitoring. It then calculates multiple indices from valid pixels and generates statistics such as mean, minimum, maximum, standard deviation and pixel count. It is turning satellite observations into orchard-specific information.
What does Orchardly monitor?
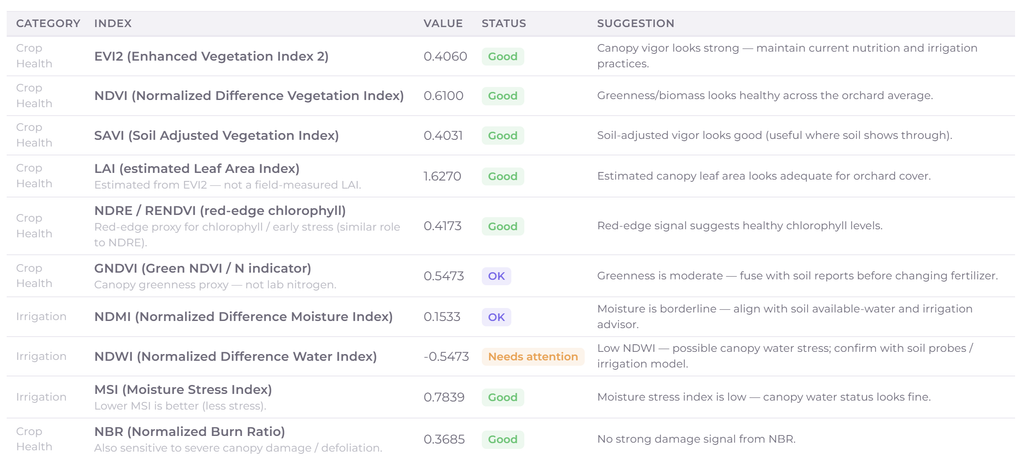
Orchardly uses several indices to look at different aspects of orchard condition.
Vegetation and canopy vigour
EVI2, NDVI and SAVI provide different perspectives on vegetation strength and canopy development.
Chlorophyll and canopy signals
NDRE / RENDVI and GNDVI provide additional information from the red-edge and green portions of the spectrum.
Moisture-related stress
NDMI, NDWI and MSI provide different perspectives on canopy moisture and water stress.
Canopy disturbance
NBR can contribute information about significant vegetation disturbance.
These signals form part of Orchardly’s broader orchard-health and irrigation-oriented monitoring system.
From satellite indices to a grower-friendly score
A grower should not need to become a remote-sensing scientist just to understand whether an orchard needs attention. This is why Orchardly can translate several satellite signals into simpler dashboard-level indicators.
Vegetation Score
A combined view of vegetation vigour using signals such as EVI2, NDVI, SAVI and red-edge information.
Water Stress Score
A combined interpretation of moisture-related signals such as NDMI, NDWI and MSI.
Nitrogen Indicator
A canopy-greenness signal derived from GNDVI and red-edge information.
Satellite Health
A broader summary of the major vegetation, water and nutrient-related signals.
Orchardly can also look at changes over approximately two weeks, helping identify whether orchard condition is improving or deteriorating rather than relying only on a single snapshot.
The map can be more useful than the score
Suppose Orchardly shows: Satellite Health: Good That does not necessarily mean the entire orchard is performing uniformly. The underlying heatmap may reveal that one section has significantly lower vegetation or moisture values.
This is why Orchardly can display spatial layers such as EVI2, NDVI and NDMI, allowing growers to see not only that an orchard is different, but where it is different.
What happens when Orchardly detects stress?
Satellite information should not exist in isolation. Suppose the satellite shows increasing canopy moisture stress. That does not automatically mean: “Increase irrigation.”
Instead, the signal should be considered alongside other orchard information. Is irrigation actually reaching that zone? What does the soil information show? Has there been unusual weather? Are trees in that section growing differently? Is there a drainage problem? Could there be a pest or disease issue?
Orchardly’s satellite information can feed into its wider orchard insights and irrigation-related advisory framework, allowing satellite signals to be considered alongside other information rather than treated as a standalone diagnosis.
reats satellite-derived nitrogen-related information as an indicator rather than a laboratory measurement.
The future of orchard monitoring is layered intelligence
Satellite imagery is only one layer of modern precision horticulture. The real opportunity comes when different sources of information work together: Satellite imagery, Weather data, Soil information, Irrigation data, Crop stage, Field observations & Agronomic knowledge.
Together, these can provide a much more complete picture of what is happening inside an orchard. This is the direction in which precision horticulture is moving: from isolated measurements toward continuous, spatial and data-driven orchard intelligence.
From looking at the orchard to understanding the orchard
For generations, growers have understood their orchards by walking them. That will not change. What is changing is the amount of information available before that walk.
A satellite can look across the entire orchard. Spectral indices can turn reflected light into measurable signals. Heatmaps can reveal spatial differences. Time-series data can show how those differences are changing. And platforms such as Orchardly can turn that complex information into something a grower can actually use.
The goal isn’t to replace the grower’s eyes. It is to help those eyes know where to look.